“Quad Core vs Dual Core” Shootout: Intel’s Q9550s vs. E8600, Part Two
Welcome to the second and latest part of our new series of shootouts. This time it is CPU vs CPU with the emphasis still on gaming performance. Here we present the battle of Intel’s popular Penryn CPUs – overclocked Core 2 Duo vs. Core 2 Quad, E8600 vs. Q9550S. We decided to break our rather extensive review of Q9550S into several standalone but related sections and this is the second part. Up-until-now, we have always depended on our Core 2 Duo E8600 at 3.99 Ghz to set the benchmarks for our video cards. Intel provided AlienBabelTech with an engineering sample of Q9550S which is their new 65 watt TDP low-power Core 2 Quad stock-clocked at 2.83 Ghz. Weeks ago, we put our then brand-new Q9550S into extensive testing to finally try to answer the question: “Is a quad core CPU necessary to get the best out of today’s modern PC games, even paired with a powerful video card?” Until recently the answer was in doubt as the Core 2 Duo processors are clocked a bit higher than their Core 2 Quad counterparts and often they would get a much higher overclock than the warmer-running quad core CPUs.
The very sam e week that Intel sent us the Q9550S, Cooler Master also provided us with their basic CPU cooler, Hyper N520! So we first spent a week with Intel’s Q9550-S beginning at stock speeds and voltages and then at progressively higher “mild” overclocks to get a feel for the new CPU and to know exactly how it performed before we started with its torture testing. Finally we went for it’s maximum overclock at Intel’s highest recommended voltage. To continue in theme with all of our past Shootout articles, in this Part II of ‘Q9550S vs. E8600’, we wanted to know what effect overclocking the CPU has on graphics performance and ultimately how it affects the frame rates of the newer games we play. Of course, we are continuing to test at two of the most popular demanding wide-screen resolutions, 1680×1050 and 1920×1200, and with maximum DX10 details whenever it is available.
We also apologize for the delay in bringing you this shootout as we had a major equipment failure when our Q9550S vs. E8600? was delayed by a Motherboard Meltdown! Our ever-faithful ASUS P5E deluxe motherboard locked up and would no longer allow access to its BIOS and I had to get a very quick open-box replacement from NewEgg.com in a ASUS Rampage Formula motherboard. After installing it, all the benchmarks were run all over again and the results were basically identical on both motherboards. Of course, we wanted to be absolutely certain of our benchmarks; although ASUS P5E Deluxe and Rampage Forumula are laid out very slightly differently they are functionally identical and P5E Deluxe can even be flashed with the Rampage BIOS.
Part One of “Quad Core vs Dual Core” Shootout: Overclocking Intel’s Q9550s with Cooler Master Hyper N520,was a short Q9550S overclocking article using Cooler Master Hyper N520, where we simply set new overclocking benches with our condensed testing suite to measure performance, scaling and stability. We also used Core Temp’s latest version, released last month, to make sure we did not get anywhere near Intel’s maximum T-junction temperatures of 100C. We were quite impressed with the Cooler Master Hyper N520 as it was able to keep our Q9550S sufficiently cool to reach its maximum stable overclock of 3.99 Ghz at Intel’s maximum recommended core voltage. Q9550S at 3.99 Ghz idled in the high-30s C and would jump into the 50s C under extreme load. We gave it 4/5 “stars” as a very good bang-for-buck basic cooler that is extraordinarily quiet due to its well-designed twin-cooling fan design. For this Part Two, we used both our Cooler Master Hyper N520 and our slightly more effective but more expensive and noiser, Thermalright/Scythe 120mm CPU cooler combination to cool both our overclocked Q9550S and E8600.

We were also totally impressed with Intel’s new Q9550S – it does everything our E8600 does, and then some! It runs 30 watts lower TDP than the “non-S” Q9550 and our only potential complaint was its $100 price premium as similar overclocking results can be had with regular Q9550 CPUs that still can be found in the retail channel. Of course, this will probably change as the best overclockers are probably picked from the center of the die for “S” Core 2 Quads now. However, where the Q9550S will find an immediate home is with OEM builders that specialize in rack-mounted servers. These low power and cooler running Q9550S CPUs are absolutely perfect for these OEMs, and in that case, the price premium is well worth it in our opinion. We gave our Q9550S “4-1/2 Stars” and an Editor’s Choice Award. We will justify that score in this and also in the following article detailing Q9550S with multi-GPU scaling. Our weeks spent with Q9550S has replaced E8600 as our CPU of choice and it is highly recommended for all PC gaming. For applications that use more than two cores, Q9550S absolutely speeds past our E8600 even when it is clocked +260Mhz higher. However, we are primarily PC gamers and we want to show you how quad core gaming compares with dual core gaming.
It is in this second part of this series that we will actually compare game benchmarks – “apples to apples” – with the Q9550S maximum 3.99 Ghz overclock to our E8600 also at 3.99 Ghz. Finally we max our Core 2 Duo out at 4.25 Ghz – its very highest stable overclock on our P5E Deluxe motherboard – so that you can see what to pick for yourself if you need an upgrade. We also test at 2.83 Ghz stock clocks for Q9550S as well as 3.40 Ghz, 3.62 Ghz and finally at 3.99 Ghz to see how frame rates may scale in game benchmarks and to try to find the “sweet spot” for a CPU overclock for playing PC games with HD4870 and GTX280 video cards. By also overclocking E8600 another +260Mhz past Q9550S stable core speed to 4.25Ghz, we can see if E8600 can somehow compensate for Q9550S having two “extra” cores for the games that use them all.

We used our Kill-A-Watt meter extensively and although we could not compare Q9550S to the “non-S” version, our total system maxed out with 291 watts and HD4870 with everything screaming and max load on all 4 cores. And interestingly we found some higher wattage used with Q9550S in certain games than with others – about 10 watts higher in World-in-Conflict than in Crysis ! We are thinking that perhaps Crysis does not use more than two cores. For the graphics, we will be using only two video cards this time – AMD’s HD4870 and Nvidia’s GTX280 to show the effect of different core speeds of both of our CPU’s overclocking performance on single-GPU powerful video cards in today’s most demanding games. For Part III, the last of our Q9550S vs. E8600 series, we will use our full benchmark suite and concentrate on two multi-GPU setups – 4870-X2 and CrossFireX-3. For this review, we picked seven modern PC games – Call of Juarez, Crysis, S.T.A.L.K.E.R. – Clear Sky, PT Boats DX10 demo, FarCry2, World-in-Conflict, and X3 Terran Conflict – plus 2 synthetic Futuremark tests 3DMark06 and Vantage. So let’s head for the testing bench and check out full disclosure:

Test Configuration
Test Configuration – Hardware
*Intel Core 2 Quad Q9550S (engineering sample reference 2.83 GHz; overclocked to 3.40 Ghz, 3.62 Ghz and 3.99 Ghz).
*Intel Core 2 Duo E8600 (reference 3.33 GHz; overclocked to 3.99 Ghz and 4.25 Ghz ).
* ASUS Rampage Formula (Intel X48 chipset, latest BIOS. PCIe 2.0 specification; crossfire 16x+16x).
* ASUS P5e-Deluxe (Intel X48 chipset, latest BIOS. PCIe 2.0 specification; crossfire 16x+16x).
* 4 GB DDR2-PC8500 RAM (2×2 GB, dual-channel at PC6400 speeds).
* Nvidia GeForce GTX280 (1 GB, nVidia reference clocks) by BFGTech
* ATi Radeon 4870 (1GB, reference clocks) by ASUS
* Onboard SupremeFX-II (ASUS P5e Deluxe motherboard daughter-card)
* 2 – Seagate Barracuda 7200.10 hard drives [setup identically, except for the graphics cards]
Test Configuration – Software
* ATi Catalyst 8.12hotfix, highest quality mip-mapping set in the driver; Catalyst AI set to “advanced”
* nVidia Geforce 181.22, high quality driver setting, LOD clamp enabled.
* Windows Vista 32-bit SP1; very latest updates
* DirectX November 2008.
* All games patched to their latest versions.
Test Configuration – Settings
* vsync off in the driver to “application decide” and never in game.
* 4xAA only enabled in-game; all settings at maximum 16xAF applied in game [or in CP except as noted; No AA/AF for Crysis]
* All results show average, minimum and maximum frame rates
* Highest quality sound (stereo) used in all games.
* Vista32, all DX10 titles were run under DX10 render paths
NOTE!!
Catalyst 8.12 HOTFIX.
* Improves DirectX10 performance in various applications in multi-core CPU systems
Known issue:
The Catalyst Control Center 3D settings option, Anisotropic Filtering does not currently work when running DirectX 10 applications – Anisotropic Filtering must be enabled within the application
We found with later testing that Catalyst 8.12 and 9.1 are quite similar and in Part III of our Shootout focusing on multi-GPU, we will start with Catalyst 9-2 and the latest Geforce drivers with a much larger sample of actual game benchmarks than presented here.

3DMark06
3DMark06 still remains the number one utility used for a system benchmark. The numbers it produces aren’t indicative of real-world gameplay – or any gameplay in general – and for that reason we really dislike using it to compare different systems. However, as long as the rest of the tech world uses it to evaluate gaming performance, we will too. We find it is mostly useful for tracking changes in a single system, what we are mostly doing now. There are four “mini-games” that it uses for benchmarking graphics, as well as two CPU tests. The scores are “weighed” and added together to give an overall number and there is a further breakdown possible with these mini games that we are charting for you.

Here is a scene from one of the four benchmark “mini games” used to benchmark GPU performance. It will give your PC a real workout even though the default resolution is only 12×10.
Here are the results of our 3DMark06 benchmark comparison using the benchmark at its default settings:

Here we see almost linear scaling with CPU frequency. If all games are like this, we would all overclock and use quad-core CPUs as it is consistently “outperforms” the Core 2 Duo – even when it is clocked +260 Mhz higher than the Core 2 Quad. Well, now let’s look at the mini-game frame rates:

Here is the identical situation exemplified in the mini-game’s frame rates. ‘Playing’ the 3DMark06 Mini-games would require an overclocked quad core CPU to get the best performance out of our HD4870 or GTX280. So, lets move on to the second benchmark, Vantage.
Next we move on to Vantage, Futuremark’s latest test. Of course, we feel the same way about Vantage as we do about 3DMark06 – it is really useful for tracking changes in a single system – especially driver changes. As it has become the new de facto standard for measuring PC video gaming performance, we will use it also. There are two mini-game tests: Jane Nash and Calico. Also there are two CPU tests but we are still focusing on the graphics performance.
Here is a scene from Vantage’s second mini-game shown at 1920×1200 resolution and with every setting fully maxed out.

Lets go right to the graphs and first check the Basic Tests with the default benchmark scores:

Again, this synthetic test matches the E8600’s highest performance with the Q9550S at default. We also note that Vantage is a better test for graphics than 3DMark06 appears to be. So, let’s look at Vantage’s mini-game frame rates:

Let’s move on to real games and real world situations and see what advantage – if any – quad core has over dual. Still, nothing really even in Vantage that you would notice actually playing these benchmarks as if they were games and nobody will play this “title”. Enough of the synthetics, as we move on to PC games!
Call of Juarez

Call of Juarez is one of the very earliest DX10 benchmark that was released in June, 2007 as a fast-paced Wild West Epic Adventure Shooter. Techland’s Call of Juarez is loosely based on Spaghetti Westerns that become popular in the early 1970s. Call of Juarez features its Chrome Engine using Shader Model 4 with DirectX 10, so the usage of Vista is mandatory for this benchmark. It isn’t built into Call of Juarez, but is a stand-alone that runs a simple fly-through of a level that’s built to showcase the game’s DX10 effects. It offers great repeatability andit is a good stress test for DX10 features in graphics cards although it is not quite the same as actual gameplay because the game logic and AI are stripped out of the demo. Still it is very useful for comparing video card performance.
Performing Call of Juarez benchmark is easy. You are presented with a simple menu to choose resolution, anti-aliasing, and two choices of shadow quality options. We set the shadow quality on “high” and the shadow map resolution to the maximum, 2048×2048. At the end of the run, the demo presents you with the minimum, maximum, and average frame rate, along with the option to quit or run the benchmark again. We always ran the benchmark at least a second time and recorded that generally higher score.
Call of Juarez DX10 benchmark at 1920×1200:
 (oops – 4870 at 19×12 “Average” is 34.7; not 37.4!)
Call of Juarez DX10 benchmark at 1650×1080:

There isn’t a lot of variance. Clearly the game is far more GPU-dependent than CPU. Here you can say there is not a lot of difference from a Q9550S at stock or overclocked to its maximum nor does Call of Juarez appear to use more than 2 cores so as to make any frame rate difference. E8600 at its highest overclock shows the best gains in Call of Juarez.
CRYSIS

Now we move on to Crysis. It is one of the most demanding games released to date for the PC. Crysis is a science fiction first person shooter by Crytek and published by Electronic Arts in late 2007. Crysisis based in a fictional near-future where an ancient alien spacecraft is discovered buried on an island near the coast of Korea. The single-player campaign has you assume the role of USA Delta Force, ‘Nomad’ in the game. He is armed with various futuristic weapons and equipment, including a “Nano Suit” which enables the player to perform extraordinary feats. Crysis uses DirectX10 for graphics rendering.
A standalone but related game, Crysis Warhead was released September, 2008. It is notable for providing a similar graphical experience to Crysis, but with less graphical demands on the PC at its highest ‘enthusiast’ settings. CryEngine2 is the game engine used to power Crysis and Warheadand it is an extended version of the CryEngine that powers FarCry. As well as supporting Shader Model 2.0, 3.0, and DirectX10’s 4.0, CryEngine2 is also multi-threaded to take advantage of SMP-aware systems. We know it takes advantage of two cores and soon we will see how it does on four-cores. Crysisalso comes in 32-bit and 64-bit versions and Crytek has developed their own proprietary physics system, called CryPhysics. However, it is noted that actually playing the game is a bit slower than the demo implies.
GPU Demo, Island
All of our settings are set to ‘maximum’ but we do NOT apply any AA/AF in the game. Here is Crysis’ Island Demo benchmarks, at 1920×1200 resolution, and then at 1680×1050.

We sense a disappointment here, perhaps. We see Crysis apparently only uses 2 CPU cores. We confirmed this somewhat also by using Kill-A-Watt to measure our system’s peak wattage and it was 10 watts less usage than with a game that apparently does use all 4 cores. Let’s look at 1650×1080:

Again, E8600 edges out Q9550S. However, the difference is usually by a single frame rate or less. Crysis does not appear to take advantage of Core 2 Quad’s “extra” two cores.
S.T.A.L.K.E.R., Clear Sky
This is the first time we are running Prologue: S.T.A.L.K.E.R., Clear Sky. The original Shadows of Chernobyl was our benchmark. Our “Shootout Series” aim is to present the latest games and DX10 benchmarks, whenever possible. So when GSC Game World released a prequel story expansion last year as Clear Sky, it naturally become a brand new DX10 benchmark for us. Both games have a non-linear storyline and they feature role-playing gameplay elements such as trading and allying with NPC factions. In both games the player assumes the identity of a S.T.A.L.K.E.R.; an illegal artifact scavenger in “The Zone” which encompasses roughly 30 square kilometers. It is the location of an alternate reality story surrounding the Chernobyl Power Plant after another (fictitious) explosion.
S.T.A.L.K.E.R. & Clear Sky feature “a living breathing world” with highly developed NPC creature AI. S.T.A.L.K.E.R., Clear Sky uses the X-ray Engine – a DirectX8.1/9/DX10/10.1 Shader model 3.0 & 4.0 graphics engine featuring HDR, parallax and normal mapping, soft shadows, motion blur, weather effects and day-to-night cycles. As with other engines using deferred shading, the original DX9c X-ray Engine does not support anti-aliasing with dynamic lighting enabled. However, the DX10 version does. We set all the graphical options – including anti-ailising – to their maximum values.
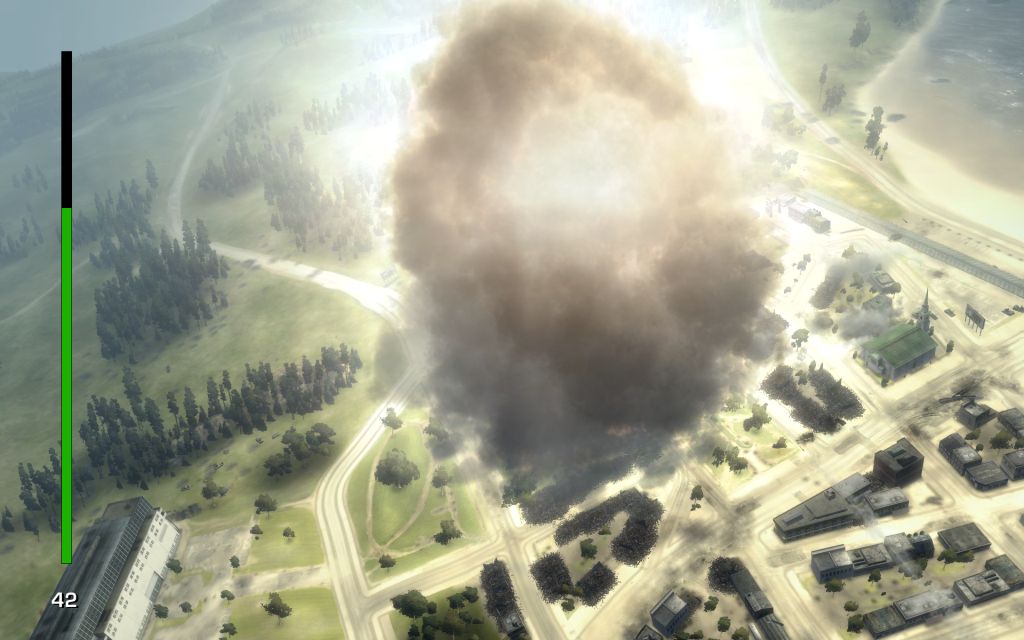
Our new 12 minute, stand-alone “official” benchmark by Clear Sky’s creators is far much more detailed and way better than the one we were using previously. As an expansion to the original game, Clear Sky is top-notch and worthy to be S.T.A.L.K.E.R’s successor with even more awesome DX10 effects which help to create and enhance their game’s incredible atmosphere. But DX10 comes with a steep HW requirement and this new benchmark really needs multi-GPU to run at its maximum settings – even below 1650×1080! We pick two of the most stressful tests out of the four that are run and detailed by the official benchmark. “Day” is the first, “night” and “rain” are less demanding but “sun shafts” approximating a bright sunny morning probably brings the heaviest penalty due to its extreme use of shaders to create DX10 and even DX10.1 effects. We ran both cards fully maxed out in DX10.0 with “ultra” settings but did not apply edge detect MSAA which kills performance even further.
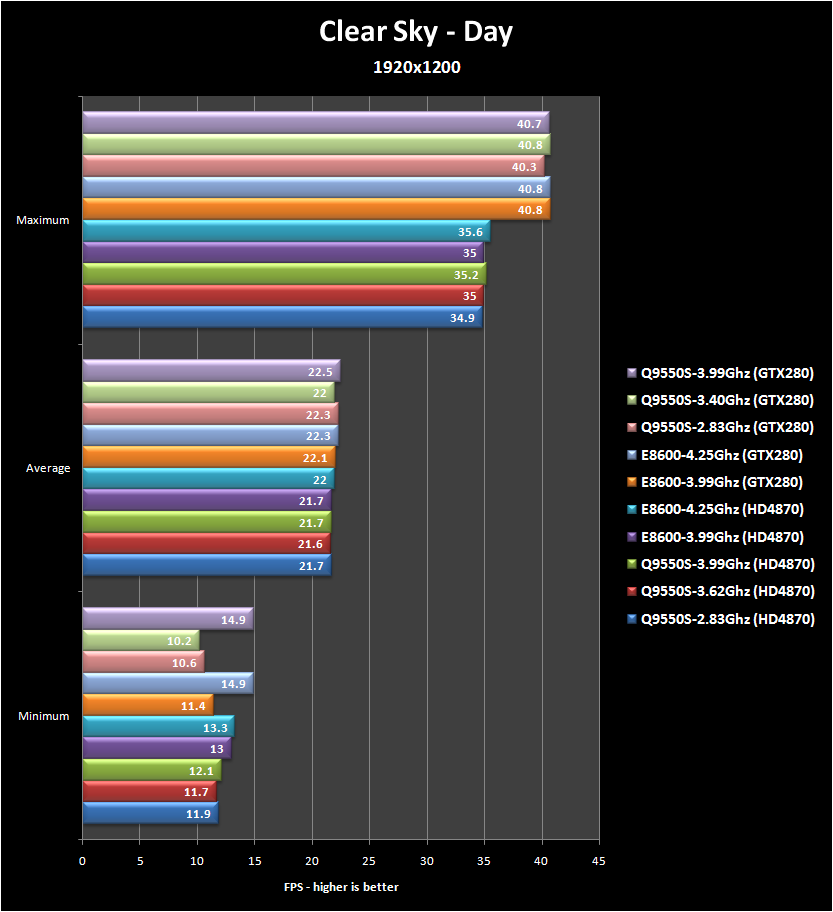
S.T.A.L.K.E.R., Clear Sky DX10 benchmark “Day” at 1920×1200:

S.T.A.L.K.E.R., Clear Sky DX10 benchmark “Sun shafts” at 1920×1200:

S.T.A.L.K.E.R., Clear Sky DX10 benchmark “Day” at 1650×1080

S.T.A.L.K.E.R., Clear Sky DX10 benchmark “Sun shafts” at 1650×1080

Another surprise … an engine that takes advantage of multi-core CPU does not give a big practical advantage over Core 2 Duo; in fact E8600 at 4.25 Ghz scores about the same as its 3.99 Ghz Core 2 Quad counterpart except in a couple of instances where they trade blows and Q9550S wins. We do see CPU scaling clearly, however.
PT Boats: Knights of the Sea DX10 benchmark

PT Boats: Knights of the Seais a stand-alone DX10 benchmark utility released by Akella, last year. It is a benchmark-friendly tech demo of their upcoming simulation-action game. This DX10 benchmark test runs reliably and apparently provides very accurate and repeatable results.
We set the only settings options available to us as follows:
DirectX Version: DirectX 10
Resolution: 1920×1600 and 1680×1050 at 60 Hz
Image Quality: High
Anti aliasing: 4x
PT Boats DX10 benchmark at 1920×1200:

PT Boats DX10 benchmark at 1650×1080:

We see really mixed results as no one is probably optimizing for this yet as it is unreleased. But generally we see CPU scaling although we do not see any real advantage to 4 cores over two in this benchmark yet. We are really looking forward to this game’s release, later this year.
FarCry2
FarCry2 uses the name of the original FarCry but it is not connected to the first game as it brings you a new setting and a new story. Ubisoft created it based on their Dunia Engine. The game setting takes place in an unnamed African country, during an uprising between two rival warring factions: the United Front for Liberation and Labor and the Alliance for Popular Resistance. Your mission is a simple one, to kill “The Jackal”; the Nietzsche-quoting mercenary that arms both sides of the conflict that you are sent into.
The FarCry2 game world is loaded in the background and on the fly to create a completely seamless open world. The Dunia game engine provides good visuals that scale well and it runs on a wide range of PC hardware. The FarCry2 design team actually went to Africa to give added realism to this game and it does work very well. One thing to note, is FarCry2’svery realistic fire propagation by the Dunia engine that is a far cry from the scripted fire and explosions that we are used to seeing up-until-now. We notice steady improvement in performance by both vendors since this AAA title was released. However, Catalyst 8-12 appeared to have had real issues with FarCry2 and required ATi to release 2 hotfixes for it. We will let you know if Catalyst 9-2 address FarCry2’s performance issues. The ‘stutter’ is definitely minimized in the latest hotfix but it still needs a bit of work for 4870.
FarCry2 benchmark at 1920×1200:

FarCry2 benchmark at 1680×1050:

Very interesting. This time our Q9550S shows an advantage over E8600. We do see quad core gaming and CPU scaling. This is the future of gaming in our opinion.
World in Conflict

World In Conflict is set in an alternate history Earth where the Cold War did not end and Russia won in 1989. The game is set after Russia invaded the USA and the remaining Americans decide to strike back. World in Conflict [WiC] is a real-time tactical/strategy video game developed by the Swedish video game company Massive Entertainment and published by Sierra Entertainment in September 2007. The expansion, World in Conflict: Soviet Assault by Ubisoft is expected next month. It features the ability to play as the Soviet Union, against which the player fought in the original World in Conflict. Although it is generally considered a real-time strategy (RTS) game, World in Conflict includes gameplay typical of real-time tactical (RTT) games. WiC is filled with real vehicles from both the Russian and American military. There are also tactical aids, including calling in massive bombing raids, access to chemical warfare, nuclear weapons, and far more.
Here is yet another amazing and very customizable and detailed DX10 benchmark that is available in-game or as a stand-alone. The particle effects and explosions in World in Conflict have taken first place in my heart away from F.E.A.R., finally! Every setting is fully maxed out.
First, World in Conflict Benchmark at 1920×1200:
World in Conflict at 1650×1080

Again, the results are mixed but we do see Q9550S pulling ahead in the minimums and in some averages over E8600. We would have to give the edge again to the quad core CPU.
X3-Terran Conflict

X3:Terran Conflict is another beautiful stand-alone benchmark that runs multiple tests and will really strain a lot of video cards with its extra-high polygon count. X3:Terran Conflict (X3:TC) is a space trading and combat simulator from Egosoft and is the most recent of their X-series of computer games released last October, 2008. X3: Terran Conflict is a standalone expansion of X3: Reunion, based in the same universe and on the same engine. It was also developed by several members of the X-Tended Mod team and features assets from it. It complements the story of previous games in the X-Universe and especially continues the events after the end of X3: Reunion.
Compared to X3: Reunion, Terran Conflict features a larger universe, more ships, and new missions. The X-Universe is huge. The Terran faction was added with their own set of technology including powerful ships and stations. Many new weapons systems were developed for the expansion and it generally received good reviews. It has a rather steep learning curve.
X3:Terran Conflict at 1920×1200
(oops, e8600 “max” results are switched with GTX280)
X3:Terran Conflict at 1650×1080:

Here we see some decent CPU scaling. There is some variation as this benchmark is divided up into many sub tests yet performance scaling appears to be king where the fastest CPU wins.
Conclusion
From our testing with Q9550S compared with E8600, we note that the Core 2 Quad does not as yet have a huge advantage in the games that we explored over Core 2 Duo – especially if you can get a nice overclock. We do see that there are several games where the Quad core has a definite advantage and we expect devs to program for more cores as newer games are released and eventually quad core will be much more important. We also see mixed scaling results. Some games get a nice boost from overclocking the CPU whereas others are far more GPU-dependent, especially since we have the tendency to completely max out the details at relatively high resolutions. We do see that “stock” 2.83 Ghz at times does hold back especially GTX280 performance a bit and at least a modest overclock to 3.40 Ghz does make some difference in the framerates. However, if you can push your CPU even further, we also see that some games continue to benefit from the highest overclock, even with a single powerful GPU.
There are still many more questions to be answered and we will have a much more detailed testing of this same platform emphasizing multi-GPU performance – HD4870-X2 and CrossFireX-3. We want to see if a faster CPU benefits even faster graphics. We will also begin with the very latest driver set available to us right now. This future testing and final article should be done within two weeks – baring further hardware failures or illness. After that, we expect to compare the maturing Intel Core i-7 CPU platform with our currently maxed out Penryn system. Eventually, we expect to also explore Nvidia GTX280/285 SLi on an X58 motherboard. And we will prepare for it by upgrading to Vista64-bit and give you a comparison vs. gaming on Vista32.
Our “Shoot-out Series”has been a steady progression examining Intel’s “Penryn” platform; one of the most popular platforms for gaming and we have been upgrading it as necessary, to maximize our PC’s gaming performance and to chart those improvements for you. Our last article, Part IV, The Summary, continued our new tradition in comparing drivers and you can actually follow our progress back to August, to Part I when we began benchmarking, even before ABT launched on October 1st, 2008. And we focused on the progress the vendors have made since then, right on through the beginning of 2009 bringing us up to date with this current CPU shootout. Since our Part III motherboard comparison was benched, each vendor has released 4 sets of drivers and we compared all of them with each other. Of course, it involved a lot of charts, nearly one hundred!
In our installment of Part III, Big GPU Shootout, PCIe 1.0 vs. PCIe 2.0, we especially focused on the motherboard’s effects on video card performance. We used the extremes – P35 PCIe 1.0 vs. X48 PCIe 2.0 with double the bandwidth and a full 16x + 16x PCIe crossfire lanes – verses the much more bandwidth-constricted 16x + 4x crossfire lanes used in the older motherboard. We saw how limiting the older motherboard’s PCIe bandwidth can be in certain situations and so we upgraded to X48.
Part II – The Big GPU Shoot-Out – Setting New Benches – also covered Catalyst 8.9 vs. Geforce 178.13 and was also tested on our P35 motherboard (PCIE 1.0/Crossfire 16x+4x) and demonstrated to us the need for overclocking our E8600 CPU from its stock 3.33 Ghz to nearly 4.0 Ghz to take full advantage of our new video cards. We also set new benchmarks with these drivers that we are still continuing to use into Part IV. Part II added a couple of more games over Part I and refined our testing slightly. We also noted that the ranking of the new video cards has remained the same: 4870-X2, GTX280 and 4870 while crossfireX-3 got more mature drivers over the last Catalyst 8.8 set.
Part I, The Big GPU Shootout: Upgrade Now or Wait? covered Catalyst 8.8 vs. Geforce 177.41 on Intel’s P35 platform as we examined the performance of five video cards. The new cards we tested were: HD4870-512MB, HD4870X2-2GB, GTX280; while 8800GTX & 2900XT represented the top and mid-range cards of the last generation. In our conclusions, we realized that last generation’s video cards are not sufficient for today’s Vista DX10 maxed-out gaming – even at 1650×1080 resolution. We even started by comparing Core 2 Duo E4300 at it its overclock of 3.33 Ghz to E8600 at its stock 3.33 GHz and found the older CPU rather lacking in comparison. We then continued on for the rest of our series with our E8600 which we later overclocked to nearly 4.0 Ghz for the next 3 reviews. This changed in the last review, when we now use Core 2 Quad Q9550S. We also started to bench with crossfireX-3 in Part I which ran on fairly immature drivers and we have continued to chart its progress until now.
Stay tuned. We think we will have some very interesting articles for you to read very shortly as you plan your own coming upgrades. Well, we are done with our benches and this part of our “Shootout” Series and we will be working on our next article: “Quad core vs. Dual core shootout: Q9550S vs. E8600”, Part 3, emphasizing multi-GPU scaling with Q9550s. In the meantime, feel free to comment below, ask questions or have a detailed discussion in our ABT forums. We also want to let you know we are running a brand new promotion with prizes and a contest next month, March, in our forums. Look for an announcement this weekend on the main ABT page. There are many good articles to be published here shortly. We want you eventually to join us and Live in Our World. It is going to expand and we think you will like what you progressively discover here.
Mark Poppin
ABT editor
Please join us in our Forums
Follow us on Twitter
For the latest updates from ABT, please join our RSS Feed


GTAIV and L4D would have been good games to add to this suite. Looks like there still isn’t a huge difference in dual vs. quad as long as you have enough speed, even in games that are multithreaded, although I think you’ll see bigger differences when you move to your Xfire tests.
Thanks for the comments. L4D is Source Engine and will scale just like HL2 which I will test next. It takes quite a bit of time to create reliable custom timedemos. Look for CoD4 to be added in the CrossFire tests which will be in a more detailed review in a couple of weeks.
In the meantime, I have a nice comparison of Phenom II vs. Athlon X2-6000+ – both with SLI’d GTX280s; probably next weekend. I will present an extreme example of CPU scaling – in some extreme cases, the frame rates doubled with the faster CPU.
Ah, I thought L4D was multi-threaded unlike a lot of Source games, but I could be mistaken.
And I’m looking forward to your AMD shootout, because I essentially have an Athlon 6000+ and I feel I’m CPU-limited in a few games, specifically TF2.
It is true that the newer Source games are enhanced and more demanding than the earlier ones. Multi-threading is probably improved. I probably will pick L4D up as a benchmark, although Source is really not one of the more demanding engines.
Here is the Source Engine Wiki:
http://developer.valvesoftware.com/wiki/Source_Engine_Features
“Multi-core. Source engine games utilize multi-core processors in both the PC and XBox 360 to deliver high-performance gaming experiences.”
The benchmarking is complete on the AMD shootout and I believe you will find the results moving from 6000+ to Phenom II much more extreme than in this current one.
We start out with a 6000+ in an AM2 board – nforce 590 based (Abit AN932x SLI); then we upgraded the board to an AM2+ ASUS Crosshair Formula II board (nforce 780A based), for Phenom II. Benchmarks were run on the performance difference from nforce 590 to 780a with the 6000+. Then with Phenom II. Everything else in the system stayed the same with SLI’d GTX280s. Of course, the OS was reinstalled but stayed as Vista64 throughout the benching.
The source engine shows very little benefit from multi-core. The touted improvements Valve promised (scaling to n-cores) have only been demonstrated in their map building tools, but not in actual games.
It’s also capped at ~300 FPS, so it skews maximum framerates above that.
Nice, makes me feel fine with a dual core still. I had thought that by now quad cores would be implemented better, guess that isn’t the case.
Thanks for the info. I’m just speaking from experience with the Source engine. When I enable multicore support in TF2 (using mat_queue_mode), my framerates (subjectively speaking) jump up by at least 50%. In some spots on maps, my framerate will drop below 30 without mat_queue_mode set to 2, but with it my framerate usually stays above 40. The bad part is that the game likes to crash itself and my system.
Also L4D, even during heavy action, runs (and looks, IMO) much better than TF2, although I haven’t done any testing with the game’s setting itself.