High Performance Gaming on a Budget: Athlon II vs. Phenom II vs. Q9550S
Welcome to our Value series, part 3. This review covers the Benchmarks: Athlon II 250 X2 vs. Phenom II 550 X2 and 720 X3 vs. Q9550S, the third part of our “High Performance Gaming on a Budget” series of reviews, “Building a Value PC with Cooler Master”. We are currently deep into a world-wide financial recession, and although most gamers would love to upgrade regularly and have Tri-Fire or SLi graphics systems powered by the most expensive overclocked quad core CPU to play their DX10 PC games, most of us must be practical. For the first time, we are going to be dealing with the word, BUDGET. We want to see how close to our Intel PC’s performance that we can come, while building a completely new PC that is not only a competent gaming performer at 1920×1200, but one that won’t break our bank.
Our introduction, High Performance Gaming on a Budget: Building a Value PC with Cooler Master and Part One, Building a Value PC with Cooler Master’s Gladiator 600 Case, were both published last week. So far, we got a handsome PC in a nicely cooled Cooler Master Gladiator 600 case ($70), a quality CPU cooler Hyper N212 ($30;to be reviewed next week) and a solid Silent Power 600 watt power supply unit (PSU; $100) that will handle a multi-core CPU and CrossFire as well as a 8X+8X PCIe CrossFire motherboard ($100) and 2×2 GB PC 8500 ($50).
Our AMD value CPUs will range from $70 to $120 and we will pick two video cards ranging from $250 to $350 for a grand total of about $700 to $800, depending on our choice of video card, GTX 280 or HD4870-X2 – the single most expensive component by far! With smart shopping, minor substitutions and rebates, you can easily shave $50 off of our general prices. We expect that you are probably upgrading from your current PC and will migrate your keyboard, mouse, optical drives, hard drives, LCD and operating system to your new build. If your PSU, case and CPU cooler are already up to the task, you can save another $200 off of our $650 to $800 total hypothetical budget that we are budgeting for these four items. In that case, you are only spending from around $450 to a maximum of $600 for your new CPU,RAM, video card and motherboard.
We picked a Gigabyte CrossFire motherboard as we are going to explore AMD’s value CPU choices and want to have an upgrade path for an ATi graphics card as they are frequently CrossFired as a bang-for-buck solution to hold off on buying a new generation of video card. We will also examine the stock and overclocked gaming performance of the Athlon II 250 X2 vs. the Phenom II 550 X2 vs. Phenom II 720 X3. The purpose of overclocking is to see now, the future performance of our AMD CPUs. In this way, this article should be relevant well into next year when AMD finally reaches near 4.0 GHz with their Phenom II. Certainly Q9550 will get no faster and Intel will depend on its soon-to-be-released Core i3/i5 to provide their value segment which we intend to explore next.
We will match our new AMD gaming builds against our current maxed out, and much more expensive, Intel Penryn Core2Quad system, Q9550s at 2.83 GHz, 3.1 GHz and 4.0 GHz. Of course, we will compare our new AMD CPUs at their stock clocks and then at each CPU’s maximum OC. To be completely fair in our benchmarking for both Intel and AMD platforms, we are benchmarking with two graphics cards each – Nvidia’s GTX 280 and ATi’s HD 4870-X2 and we are using identically configured PCs and identical hard drives in comparing them.
We are using Catalyst 9-6 and GeForce 186.18 for this review; final certified drivers are used for all of our testing all through our review series. Identical 250 GB hard drives are set up with the latest version of Vista 64; each with identical programs, updates and patches – the only differences are the CPUs and the motherboards required for their respective AMD and Intel platforms. Of course, two video cards are compared on each platform so we can judge the effect each different CPU – at stock and at maximum overclock – has on gaming performance. We are continuing to test at two of the most popular demanding wide-screen resolutions, 1680×1050 and 1920×1200, 4xAA plus 16xAF and with maximum DX10 details whenever it is available. And we are looking to do this all on a budget.
Our GPU reference cards are:
- GeForce GTX 280 1GB (602/1107) – it now costs about $250 and is the approximate performance equal of the popular choices, GTX 275 and HD 4890.
- HD 4870-X2 (750/900) which is very similar to 4870 CrossFire at stock speeds and it costs about $350 now.
Our reference CPUs are:
- Athlon II 250 X2 at 3.0 GHz and at 3.9 GHz ($70)*
- Phenom II 550 X2 at 3.1 GHz and at 3.9 GHz ($100)
- Phenom II 720 X3 at 2.8 GHz and at 3.5 GHz ($120)
- Q9550s at 2.83 GHz, 3.1 GHz and at 4.0 GHz ($250-$350)
We are paying particular attention to how the drivers have changed overall in relation to each other and we are also setting new benches for you with Cat 9-6 and GeForce 188.18 which you can directly compare with the same video cards – GTX 280 and HD 4870-X2 – that were tested in our Big GPU Shootout, Revisited, at the end of June with Catalyst 9-5 and Geforce 185.85. In fact, you can follow the driver progress of HD 4870-X2 vs. GTX 280 back for over a year through our series to when we first launched AlienBabelTech!
*Please note that our Athlon 250 X2 was supplied by AMD (our Phenom II 550/720 were purchased along with the Gigabyte motherboard and RAM from NewEgg.com) and this editor only had a very limited time to test it before sending it on to Karan for his own Value Platform Analysis article. Even so, we can see the Athlon II architecture scaling compared with the Phenom II scaling with 4870-X2 or 4870 CrossFire.

Test Configuration
Test Configuration – Intel Hardware
- Intel Core 2 Quad Q9550S (engineering sample reference 2.83 GHz and overclocked to 3.1 and 4.0 GHz)
- ASUS Rampage Formula (Intel X48 chipset, latest BIOS, PCIe 2.0 specification; CrossFire 16x+16x).
- 4 GB OCZ DDR2-PC8500 RAM (2×2 GB, dual-channel at PC 8500 speeds)
- ATi Radeon HD 4870-X2 (2GB, reference clocks 750/900) by VisionTek
- Nvidia GeForce GTX 280 (1GB, reference clocks) by BFG Tech
- Onboard SupremeFX-II (ASUS Rampage Formula motherboard daughter-card)
- 2 – 250 GB Seagate Barracuda 7200.10 hard drives
- OCZ 850 watt power supply
Test Configuration – AMD Hardware
- Athlon II 250 X2 at 3.0 and 3.915 GHz (supplied by AMD) – Please note that this CPU was only tested with 4870-X2; not with GTX 280.
- Phenom II 550 X2 at 3.1 and 3.896 GHz
- Phenom II 720 at 2.8 and 3.486 GHz
- Gigabyte GA-MA790X-UD4P (latest BIOS, PCIe 2.0 specification; CrossFire 8x+8x).
- 4 GB OCZ Fatal1ty DDR2-PC8500 RAM (2×2 GB, dual-channel at PC 8500 speeds)
- ATi Radeon HD 4870-X2 (2GB, reference clocks 750/900) by VisionTek
- Nvidia GeForce GTX280 (1GB, reference clocks) by BFG Tech
- Onboard Realtek Audio
- 2 – 250 GB Seagate Barracuda 7200.10 hard drives
- Cooler Master Silent Power 600 M, 600 watt power supply
Test Configuration – Software
- ATi Catalyst 9-6; highest quality mip-mapping set in the driver, Catalyst AI set to “Standard”
- GeForce 186.18; high quality filtering; optimizations off and LOD clamp enabled
- Windows Vista 64-bit SP1; very latest updates
- DirectX March 2008.
- All games are patched to their latest versions.
- vsync is off in the control panel and is never set in-game.
- 4xAA enabled in all games and “forced” in Catalyst Control Center for UT3; all in-game settings at “maximum” or “ultra” with 16xAF always applied
- All results show average, minimum and maximum frame rates except as noted.
- Highest quality sound (stereo) used in all games.
- Vista 64, all DX10 titles were run under DX10 render paths

3DMark06
3DMark06 still remains the number one utility used for a system benchmark. We find that it is mostly useful for tracking changes within a single system. There are four “mini-games” that it uses for benchmarking graphics, as well as two CPU tests. The scores are weighed and added together to give an overall “score” and there is a further frame rate breakdown possible with these mini-games that we are charting for you.

Here is a scene from “Canyon Flight” in 3DMark06, a mini-game which is used to benchmark performance. These tests will still give your PC a real workout even though its default resolution is only 1280×1024. Here are the results of our 3DMark06 benchmark comparison using the benchmark at its default settings:

We see just scores; and now with the GTX 280

The results are just scores. Often a little variability will occur by just running the tests over and over. Now the mini-game frame rates with our HD 4870-X2:

Now the GTX 280 mini-game framerates:
 As though we were ‘playing’ the 3DMark06 mini-games, we note the framerate rankings and note that all of our CPUs scale with the core clock increase. If they were games, they would all be quite playable and they would be indistinguishable from each others platform. So, let’s move on to our second synthetic benchmark, Vantage.
Vantage
Vantage is Futuremark’s latest test. It is really useful for tracking changes in a single system – especially driver changes. There are two mini-game tests, Jane Nash and Calico and also two CPU tests, but we are still focusing on the graphics performance.
Here is a scene from Vantage’s second mini-game.

Let’s go right to the graphs and first check the Basic Tests with the default benchmark scores:

Now with the GTX 280:

We see more scores. Now let’s look at the mini-game frame rates, first with the HD 4870-X2:

Now the mini game framerates with our GTX 280:

We see the framerates are very close with our single-GPU, GTX280 and all 3 of our CPUs. Paired with the HD 4870-X2, the Athlon II 250 gets the biggest FPS boost from overclocking. Enough of the synthetics as we move on to PC games and real world situations!
Call of Juarez
 Call of Juarez is one of the very earliest DX10 games. Techland’s Call of Juarez is loosely based on Spaghetti Westerns that became popular in the early 1970s. Call of Juarez features its Chrome Engine using Shader Model 4 with DirectX 10. Our benchmark isn’t built into Call of Juarez, but is an official stand-alone that runs a simple flyby of a level that is created to showcase its DX10 effects. It offers good repeatability and it is a good stress test for DX10 features in graphics cards, although it is not quite the same as actual gameplay because the game logic and AI are stripped out of this demo.
Performing Call of Juarez benchmark is easy. You are presented with a simple menu to choose resolution, anti-aliasing, and two choices of shadow quality options. We set the shadow quality on “high” and the shadow map resolution to the maximum, 2048×2048. At the end of the run, the demo presents you with the minimum, maximum, and average frame rate, along with the option to quit or run the benchmark again. We always ran the benchmark at least a second time and recorded that generally higher score.
Call of Juarez DX10 benchmark at 1920×1200 with the HD 4870-X2:

Here it appears that simple clockspeed is not the biggest variable. The dual-core Athlon II and Phenom II both get minimums in the lowest 20s whereas the 720 X3 is significantly faster with its third core and it comes within a couple of FPS of Q9550S when they are both stock clocked.
Now with our GTX 290 at 1920×1200 we see that there is not a lot of difference with any CPU at the minimum frame rates; this time the maximums belong to the Intel PC:

Now at 1680×1050 with the HD4870-X2 we note much the same trend as it was for 1920×1200 where the lower resolution does not make a lot of difference to our framerates:

Let’s look at the GTX 280 at 1680×1050:
 Call of Juarez is a little strange at 1680×1050 with our GTX 280. This time, the AMD CPUs edge out the Q9550s in the minimum by a couple of frames per second. It really takes multi-GPU to play this game fully maxed out. The HD 4870-X2’s frame rates are completely satisfactory at 1920×1200 with completely maxed-out details and with 4xAA/16xAF applied but only with our quad core Intel CPU and also with our AMD tri-core; the dual-core CPUs fall short. To play Call of Juarez satisfactorily with GTX 280, you will need to lower some details and/or AA with any CPU you choose.
CRYSIS
 Next we move on to Crysis, a science fiction first person shooter by Crytek. It remains one of the most demanding games for any PC and it is also still one of the most beautiful games released to date. Crysis is based in a fictional near-future where an alien spacecraft is discovered buried on an island near the coast of Korea. The single-player campaign has you assume the role of USA Delta Force, ‘Nomad’ who is armed with futuristic weapons and equipment. Crysis uses DirectX10 for graphics rendering.
A standalone but related game, Crysis Warhead was released last year. CryEngine2 is the game engine used to power Crysis and Warhead and it is an extended version of the CryEngine that powers FarCry. As well as supporting Shader Model 2.0, 3.0, and DirectX10’s 4.0, CryEngine2 is also multi-threaded to take advantage of SMP-aware systems and Crytek has developed their own proprietary physics system, called CryPhysics. However, it is noted that actually playing this game is a bit slower than the demo implies.
GPU Demo, Island
All of our settings are set to ‘maximum’ including 4xAA and we force 16AF in the control panel. Here is Crysis’ Island Demo benchmark, first at 1920×1200 resolution with the HD 4870-X2 and our 4 CPUs; but we will save our comments until after all four charts are displayed:

Now at 1920×1200 with the GTX 280:

Now at 1680×1050 with our HD 4870-X2:

Finally our GTX 280 at 1680×1050:

Crysis is quite playable with HD 4870-X2 and with all of our overclocked CPUs, even with 4xAA/16xAF, if you are willing to tweak some of your settings a bit downward. Here we generally see our overclocked CPUs sitting within a couple of frames per second, except at 1680×1050 with the HD 4870-X2 where the Q9550S pulls ahead in the minimum. Pure core speed is most important with our slower overclocked tri-core losing to both the faster-clocked Phenom II dual-core and occasionally to the overclocked Athlon II dual-core. In this case of comparing dual cores, clock for clock, we would chose the Phenom II over the Athlon II with them at their stock clocks; overclocked the performance is very close when paired with our HD 4870-X2.
With GTX 280, there is very little difference in the framerates no matter where we look at either resolution. Just one or two frames per second separate the fastest CPU from the slowest.
S.T.A.L.K.E.R., Clear Sky

Prologue: S.T.A.L.K.E.R., Clear Sky became a brand new DX10 benchmark for us when GSC Game World released a prequel story expansion to the original Shadows of Chernobyl, last year. Both games have non-linear storylines which feature role-playing game elements. In both games, the player assumes the identity of a S.T.A.L.K.E.R.; an illegal artifact scavenger in “The Zone” which encompasses about 30 square kilometers. It is the location of an alternate reality story surrounding the Chernobyl Power Plant after another (fictitious) explosion.
S.T.A.L.K.E.R. & Clear Sky feature “a living breathing world” with highly developed NPC creature AI. S.T.A.L.K.E.R., Clear Sky uses the X-ray Engine – a DirectX8.1/9/DX10/10.1 Shader model 3.0 & 4.0 graphics engine featuring HDR, parallax and normal mapping, soft shadows, motion blur, weather effects and day-to-night cycles. As with other engines using deferred shading, the original DX9c X-ray Engine does not support anti-aliasing with dynamic lighting enabled, although the DX10 version does.
We are using the stand-alone “official” benchmark by Clear Sky’s creators. Clear Sky is top-notch and worthy to be S.T.A.L.K.E.R’s successor with even more awesome DX10 effects which help to create and enhance their game’s already incredible atmosphere. Unfortunately, DX10 comes with steep hardware requirements and this new game really needs multi-GPU to run at its maximum settings. We picked the most stressful test out of the four, “Sun shafts”. It brings the heaviest penalty due to its extreme use of shaders to create DX10/DX10.1 effects. We ran this benchmark fully maxed out in DX10.0 with “ultra” settings plus 4xAA, but did not apply edge-detect MSAA which chokes performance even further.
S.T.A.L.K.E.R., Clear Sky DX10 benchmark “Sun shafts” at 1920×1200, first with the HD 4870-X2:

Now at 1920×1200 resolution with the GTX 280:

And now with the HD 4870-X2 at 1680×1050:

Finally with the GTX 280 at 1680×1050:

This time, with our HD 4870-X2 we do not see a lot of difference anywhere. Less than two frames per second separate the fastest CPU from the slowest one. With the GTX 280, the difference climbs to slightly over 3 frames per second difference – and that is between the stocked-clocked 3.1 GHz Phenom II 550 X2 and the highly overclocked Q9550s at 4.0 GHz – and only in the maximum frame rate! Practically there is no real difference gained with any CPU; the video card will make the most difference with Clear Sky’s performance.
PT Boats: Knights of the Sea DX10 benchmark

PT Boats: Knights of the Sea is a stand-alone DX10 benchmark utility released by Akella last year. It is actually a tech demo of their upcoming simulation-action game. This DX10 benchmark test runs reliably and apparently provides very accurate and repeatable results.
We set the only settings options available to us as follows:
DirectX Version: DirectX 10
Resolution: 1920×1600 and 1680×1050 at 60 Hz
Image Quality: High
Anti aliasing: 4x
PT Boats DX10 benchmark, first with the HD 4870-x2 at 1920×1200:

Now with the GTX 280 at 1920×1200:

Here is 1680×1050 resolution with HD 4870-X2:

Let’s look at 1680×1050 with the GTX280:

Here with our HD 4870-X2 we see the stock Phenoms lagging badly behind Q9550S – until they are overclocked. At that point, the Athlon II and Phenom IIs gain the most benefit from overclocking and begin to come very close to our Q9550S overclocked performance; only the Athlon II lags a bit behind the other CPUs. With our single GPU, GTX 280, there is no practical difference running PT Boats on any CPU except at 1920×1200 when comparing the minimums of the AMD CPUs to the highest Q9550S overclock.
FarCry 2

Far Cry 2 uses the name of the original Far Cry but it is not connected to the first game as it brings you a new setting and a new story. Ubisoft created it based on their Dunia Engine. The game setting takes place in an unnamed African country, during an uprising between two rival warring factions. Your mission is to kill “The Jackal”; the Nietzsche-quoting mercenary that arms both sides of the conflict that you are dropped into.
The Far Cry 2 game world is loaded in the background and on the fly to create a completely seamless open world. The Dunia game engine provides good visuals that scale well. The Far Cry 2 design team actually went to Africa to give added realism to this game. One thing to especially note is Far Cry 2’s very realistic fire propagation by their engine that is a far cry from the scripted fire and explosions that we are used to seeing.
First we test Far Cry 2 benchmark at 1920×1200 with our HD 4870-X2 – all resolutions tested are with AI enabled:

Now with the GTX 280 at 1920×1200:

Now at 1680×1050; first with the HD 4870-X2:
 Now with our GTX 280 at 1680×1050:

Both of our video cards can play Far Cry 2 very satisfactorily at the resolutions chosen for them with any CPU except for the Athlon II at its stock clock at the minimum. Here we see scaling and the number of CPU cores come into play. The slower overclocked 720 X3 at 3.5 GHz does a bit better than the faster overclocked Athlon II and Phenom II and the Q9550s at 4.0 GHz pulls away from the crowd in the minimums and averages with our HD 4870-X2.
On the other hand, we see the results much closer with our GTX 280 and this time our Phenom II 720 X3 trades blows with the 4.0 GHz Q9550S and even beats it in the minimums and averages. Even the Athlon II and Phenom II occasionally pass the Q9550S!
World in Conflict

World In Conflict is set in an alternate history Earth where the Cold War did not end and Russia invaded the USA in 1989 and the remaining Americans decided to strike back. World in Conflict (WiC) is a real-time tactical/strategy video game developed by Massive Entertainment. Although it is generally considered a real-time strategy (RTS) game, World in Conflict includes gameplay typical of real-time tactical (RTT) games. WiC is filled with real vehicles from both the Russian and American military. There are also tactical aids, including calling in massive bombing raids, access to chemical warfare, nuclear weapons, and far more.
Here is yet another amazing and very customizable and detailed DX10 benchmark that is available in-game or as a stand-alone. The particle effects and explosions in World in Conflict are truly spectacular! Every setting is fully maxed out. First at 1920×1200 resolution with our HD 4870-x2:
 Now at 1920×1200 with our GTX 280:
 World in Conflict at 1680×1050 with the HD 4870-X2:
 And now at 1680×1050 with the GTX 280:
 The HD 4870-X2 is really handicapped by two factors with our Athlon II and Phenom II X2s. First, their stock clockspeeds are not enough to keep World-in-Conflict minimum framerates even in the low teens; an overclock is required to do that. Secondly, it appears that the tri-core 720 X3’s third core makes a definite difference over dual-core although the sheer +500 MHz advantage of the Q9550S overclock gives it a solid advantage in the minimums and even some advantage in the averages.
This same pattern with our HD 4870-X2 is repeated with the GTX 280 – clock speed matters and evidently more than a dual-core CPU is needed for the minimums of World-in-Conflict. We even note that our Intel quad-core CPU at 3.1 GHz is pulling away from the AMD tri-core clocked +400 MHz higher.
X3-Terran Conflict

X3:Terran Conflict (X3:TC) is another beautiful stand-alone benchmark that runs multiple tests and will really strain a lot of video cards. X3:TC is a space trading and combat simulator from Egosoft and is the most recent of their X-series of computer games. X3:TC is a standalone expansion of X3: Reunion, based in the same universe and on the same engine. It complements the story of previous games in the X-Universe and especially continues the events after the end of X3: Reunion.
Compared to Reunion, Terran Conflict features a larger universe, more ships, and of course, new missions. The X-Universe is huge. The Terran faction was added with their own set of technology including powerful ships and stations. Many new weapons systems were developed for the expansion and it has generally received good reviews. It has a rather steep learning curve.
First at 1920×1200 with the HD 4870-X2:
 Now with our GTX 280 at 1920×1200:

X3:Terran Conflict at 1680×1050, first with the HD 4870-X2:
 And now at 1650×1080 with our GTX 280:

There is no reason to be dissatisfied with any of the configurations that we tested, except at the minimums which only varies between 12-21 FPS for all of them. Playing with the HD 4870-X2, we prefer the fastest clock speed possible from any CPU although the Athlon II lags behind the Phenom II which trades blows with and sometimes surpasses our Q9550S. With the GTX 280, we would generally prefer our Intel CPU if at the same clocks as the AMD CPUs.
Enemy Territory: Quake Wars

Enemy Territory: Quake Wars is an objective-driven, class-based first person shooter set in the Quake universe. It was developed by id Software and Splash Damage for Windows and published by Activision. Quake Wars pits the combined human armies of the Global Defense Force against the technologically superior Strogg, an alien race who has come to earth to use humans for spare parts and food. It allows you to play a part, probably best as an online multi-player experience, in the battles waged around the world in mankind’s desperate war to survive.
Quake Wars is an OpenGL game based on id’s Doom3 game engine with the addition of their MegaTexture technology. It also supports some of the latest 3D effects seen in today’s games, including soft particles, although it is somewhat dated and less demanding on video cards than many DX10 games. id’s MegaTexture technology is designed to provide very large maps without having to reuse the same textures over and over again. For our benchmark we chose the flyby, Salvage Demo . It is one of the most graphically demanding of all the flybys and it is very repeatable and reliable in its results. It is fairly close to what you will experience in-game. All of our settings are set to ‘maximum’ and we also apply 4xAA/16xAF in game.
First we test at 1920×1200 resolution with the HD4870-X2:
 And now at 1920×1200 with the GTX 280:
 Salvage Demo fly-by at 1680×1050 resolution with our HD 4870-X2:
 Finally at 1650×1080 with the GTX 280:
 There are no longer any serious issues with artifacting with Catalyst 9-6 and our HD 4870-X2 that we had with the earlier 9-5 driver. Still, all of these video cards and CPU combinations at any clockspeed have no trouble handling this game fully maxed out. But this time, the situation dramatically reverses and it appears that ET:QW is simply faster on the AMD architecture with the drivers and hardware that we used.
F.E.A.R.

F.E.A.R. – First Encounter Armed Assault – is a DX9c game by Monolith Productions that was originally released in October 2005 by Vivendi Universal Production. Later, there were two expansions with the latest, Perseus Mandate, released in 2007. Although the game engine is aging a bit, it still has some of the most spectacular effects of any game. F.E.A.R. showcases a powerful particle system, complete with sparks and smoke for collisions as well as featuring bullet marks and other effects including “soft shadows”. This is highlighted by the built-in performance test, although it was never updated. This performance test will tell you how F.E.A.R. will run, but both of its expansions are progressively more demanding on your PC graphics and will run slower than the demo. We always run at least two sets of tests with all in-game features at ‘maximum’. F.E.A.R. uses the Jupiter Extended Technology engine from Touchdown Entertainment.
We test with the most demanding settings. Fully maxed details with 4xAA/16xAF; soft shadows ‘off’, as they do not play well with AA. Let’s start again first at 1920×1200 with the HD 4870-X2:
 Now at 1920×1200 with the GTX 280:
 Now at 1680×1050 with our HD 4870-X2:

Finally with the GTX 280 at 1680×1050 resolution:

In this case, our GTX 280 has the best minimum framerates as the HD 4870-X2 still appears to be having driver issues and some hiccups with its minimums as it did with the earlier Catalyst drivers. Even so, there is only 4 frames per second difference between the fastest and the slowest CPU. vHere we see that our GTX 280 si scoring within two frames per second on the minimums from the slowest clocked Athlon II compared to our overclocked Q9550S at 4.0 GHz. There is really no practical difference you will see playing F.E.A.R. with any CPU combination we used.
Lost Planet DX10 benchmark

Lost Planet: Extreme Condition is a Capcom port of an Xbox 360 game. It takes place on the icy planet of E.D.N. III which is filled with monsters, pirates, big guns, and huge bosses. This frozen world highlights high dynamic range lighting (HDR) as the snow-white environment reflects blinding sunlight as DX10 particle systems toss snow and ice all around. The game looks great in both DirectX 9 and 10 and there isn’t really much of a difference between the two versions except perhaps shadows. Unfortunately, the DX10 version doesn’t look that much better when you’re actually playing the game and it still runs slower than the DX9 version.
We use the in-game performance test from the retail copy of Lost Planet and updated through Steam to the latest version for our runs. This run isn’t completely scripted as the creatures act a little differently each time you run it, requiring multiple runs. Lost Planet’s Snow and Cave demos are run continuously by the performance test and blend into each other.
Here are our benchmark results with the more demanding, Snow. All settings are fully maxed out in-game including 4xAA/16xAF. First at 1920×1200 resolution with the HD 4870-X2:
 Now at 1920×1200 with the GTX 280:
 And now at 1680×1050 with our HD 4870-X2:

And finally the GTX 280 at 1680×1050:
Here we see that clock speed is crucial with Lost Planet with both of our video cards. Perhaps the Athlon II 250 X2 lag a little behind the Phenom II and Penryn architecture, but there is no real difference with any combination of hardware that we used at either resolution.
Unreal Tournament 3

Unreal Tournament 3 (UT3) is the fourth game in the Unreal Tournament series. UT3 is a first-person shooter and online multiplayer video game by Epic Games. Unreal Tournament 3 provides a good balance between image quality and performance, rendering complex scenes well even on lower-end PCs. Of course, on high-end graphics cards you can really turn up the detail. UT3 is primarily an online multiplayer title offering several game modes and it also includes an offline single-player game with a campaign.
For our tests, we used the very latest game patch for Unreal Tournament 3, released after its ‘Titan’ pack. The game doesn’t have a built-in benchmarking tool so we used FRAPS and did a fly-by of a chosen level. Here we note that performance numbers reported are a bit higher than compared to in-game. The map we use is called “Containment” and it is one of the most demanding of the fly-bys. Our tests were run at resolutions of 1920 x 1200 and 1680 x 1050 with UT3’s in-game graphics options set to their maximum values.
One drawback of the way the UT3 engine is designed is that there is no support for anti-aliasing built in so we forced 4xAA in each vendor’s control panel. We record a demo in the game and a set number of frames are saved in a file for playback. When playing back the demo, the game engine then renders the frames as quickly as possible, which is why you will often see it playing it back more quickly than you would actually play the game.
Here is Containment Demo at 1920×1200 with our HD 4870-X2:
 And now with the GTX 280 at 1920×1200:
 And now at 1680×1050 with our HD 4870-X2:

And finally at 1680×1050 with the GTX 280:
 There is absolutely no problem playing this game fully maxed out with any of our video cards with any CPU at our chosen resolutions except perhaps for the stock clocked AMD CPUs for the minimums. We notice that both overclocking and the amount of cores do make a difference with the Unreal engine; there is good scaling from both overclocking and from tri- and quad-core CPUs.
Call Of Duty 4: Modern Warfare

Call of Duty 4: Modern Warfare (CoD4) is a first person shooter running on a custom engine. There are nice graphics but the engine is somewhat dated compared to others and it runs well on modern PCs. It is the first CoD installment to take place in a modern setting instead of in World War II. It differs from the previous Call of Duty games by having a more film-like plot that uses intermixed story lines from two perspectives; that of a USMC sergeant and a British SAS sergeant. There is also a variety of short missions where players control other characters in flashback sequences to advance the story. Call of Duty 4’s move to modern warfare introduced a variety of modern conventional weapons and technologies including plastic explosives.
There are currently 20 multiplayer maps in CoD4. It is very popular and there is a new expansion for it. For multiplayer, it includes five preset classes and introduces the Perks system. Perks are special abilities which allow users to further customize their character to suit their personal style. Our timedemo benchmark was created by ABT’s own Senior Editor and lead reviewer, BFG10K. It is very accurate and totally repeatable.
Here is our HD 4870-X2 at 1920×1200 resolution:
 And now with the GTX 280 at 1920×1200:
 And now at 1650×1080 with our HD 4870-X2:
 And now finallyat 1680×1050 with the GTX 280 :
 We see results similar to Unreal Tournament 3. A popular multiplayer game is very playable even on midrange graphics cards from the last generation and it plays very smoothly with this generation’s video cards and stock clocked CPUs. However, this time the framerates appear to be tied directly to the CPU’s clockspeed – not the number of cores – and all of our tested configurations breeze through this benchmark.
Half-Life 2: Lost Coast

Half-Life 2 is still a popular game and it is the oldest game we review for this series. Half-Life 2: Lost Coast is an additional level for this 2004 game. Lost Coast was released October, 2005 as a free download to all purchasers of Half-Life 2. Lost Coast was developed as a playable tech demo that was evidently intended to showcase the newly-added high definition range (HDR) lighting features of the Source Engine. A flyby of this level is played during the HL2 video stress test and it is very repeatable. All in-game settings are maxed out, including 4xAA/16xAF. First we test at 1920×1200 with our HD 4870-X2: Now with the GTX 280 at 1920×1200:
 Now at 1650×1080 resolution with the HD 4870-X2:

Finally at 1680×1050 with the GTX 280:
 Although all of our configurations breeze through this benchmark, clockspeed makes the biggest difference in the framerates we experience. Perhaps the Source engine slightly favors Penryn over Phenom II and the Athlon II architecture is the slowest at similar clocks.
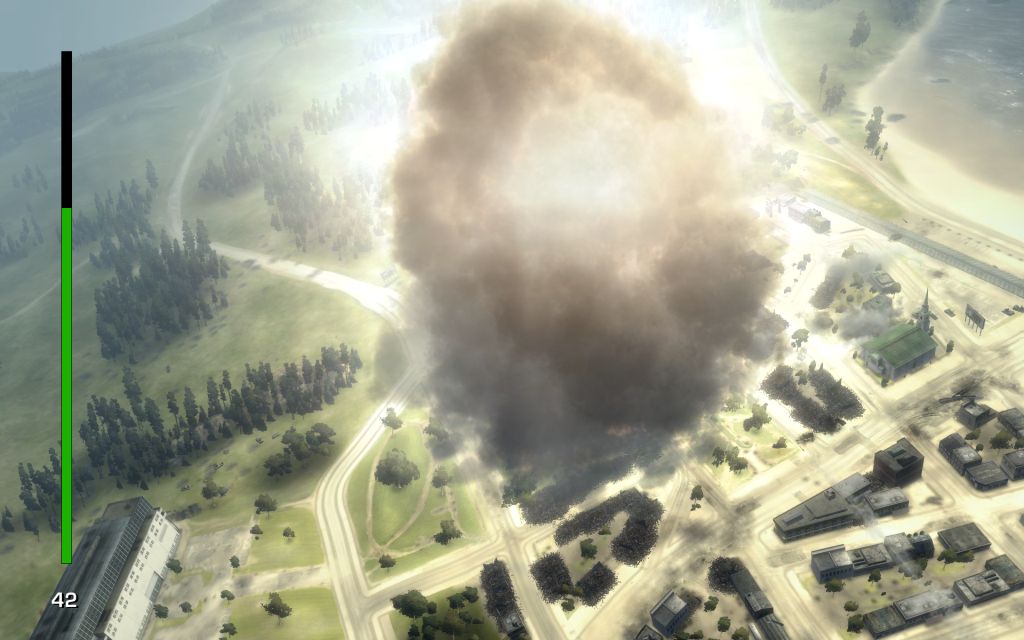
ARMA 2 Demo
 ARMA 2 is our newest benchmark and it is taken from the third installment in their series of realistic modern military simulation games from Bohemia Interactive. It features a player-driven story with more than 70 weapons and over 100 different vehicles. With a game world of 225 square km that is taken from actual surveillance photos, you can expect truly massive online battles with five distinct armed groups to choose from. ARMA2 can be considered a tactical shooter where the player commands a squad of AI – or many squads – with elements of real-time tactics.
ARMA 2 Demo was released in late June, 20o9 and coming in at 2.6 GB, the ARMA 2 demo allows you to experience the same gameplay that is featured in the full version of ARMA 2 – including multiplayer, as well as a few of the vehicles, weapons and units. The ARMA2 demo also contains a part of Chernarus terrain, a small section of the full game world set in the fictional “Black Russia”. There is also a massive performance hit on any platform when maximum details are enabled at the resolutions that we test.
Here is our HD 4870-X2 at 1920×1200 resolution:
 Now with our GTX 280 at 1920×1200:
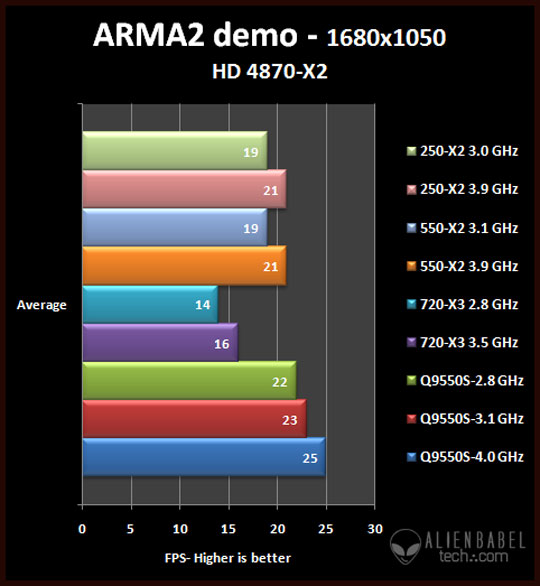
 Next is the HD 4870-X2 at 1680×1050:

Now we finally finish up all of our benchmarks with our GTX 280 at 1680×1050 resolution:
 We see some rather interesting results with ARMA2 that require further investigation. With our HD 4870-X2, it appears that there is more than just framerate scaling tied to CPU core speed; here the tri-core 720 X3 falls miserably behind both the quad-core and dual-core CPUs. With our GTX 280, the results are a bit more even within the tested resolutions but the oddities the benchmarks exhibit can probably be attributed to a brand new game and its issues with drivers. We look forward to coming back to ARMA2 with newer drivers in the “motherboard” and also the latest drivers in the “performance tweaking” part of our series due to be published later on this month.
Conclusion
This has been quite an enjoyable exploration for us into comparing our Core2Quad Intel PC with Athlon II 250 X2, Phenom II 550 X2 and 720 X3 with our benchmark suite. We hope to continue to expand on it in the weeks to come with perhaps Phenom II X4 vs. Intel’s newest value platform – Core i5.
As you can see from our benchmarks, if you want absolutely the very fastest framerates with your HD 4780-X2 or your GTX 280 – and cost is no object – you will chose the fastest quad-core CPU you can afford and overclock it as far as you can. We also see that as your video card gets more powerful, generally your CPU needs to also be progressively faster to match it. We noted that there was generally less difference with varying clockspeeds and the amount of CPU cores needed with our single GTX 280; often the differences were magnified by using HD 4870-X2. So, future and more powerful video card purchases should be considered whenever you upgrade your CPU.
Of of our fourteen gaming benchmarks, only World-in-Conflict seems to really benefit from a quad-core. However, to balance it, Enemy Territories: Quake Wars is generally faster with our test setup with the AMD CPUs than with Intel’s. The rest of the dozen benchmarks demonstrate that all of our CPUs all run fairly close performancewise and satisfactorily once they are overclocked to approximately 3.5 GHz. Our conclusion would have us believe that the videocard is the single most important factor for dermining most game’ framerates at maximum detail. As long as there is a decent dual-core or tri-core, one is not really losing much by not having four CPU cores – other than bragging rights – in most games.
We intend to return again to this subject in a few months, especially as more games are optimized for multi-core CPUs. We are only about half-way done with our Value series and you can expect to see reviews from us covering Cooler Master’s Hyper N212 Universal CPU cooler and Silent Power 600 M as we continue to build our AMD PC and test it against our Intel PC. We will update to the latest drivers as we continue on reviewing our AMD Gigabyte 8x+8x PCIe CrossFire motherboard and also in optimizing our CPU overclocks. Stay tuned. The fun has just begun.
In the meantime, feel free to comment below, ask questions or have a detailed discussion in our ABT forum. We want you to join us and Live in Our World. It is fast expanding and we think you will like what you progressively discover here.
Mark Poppin
ABT Senior Editor
Please join us in our Forums
Follow us on Twitter
For the latest updates from ABT, please join our RSS News Feed


This review needs to be updated regarding ET:QW.
The results of the Phenom II’s frame rates were evidently overstated. We cannot go back in time to find out exactly why; however, when we set up the older drivers on a new install, the results are very
similar to what we are posting in our latest review:
http://alienbabeltech.com/main/?p=13034&page=12
My apologies for my error. Normally they would be caught with the very next driver testing.
Mark Poppin
November 22, 2009
It should be Athlon II X3 vs Phenom II X2, since they close in value
Have to say, THANK YOU unbelievably for this site!!
Not often you find a decent blog which isn’t just all lies nowerdays 😛
I’ve already bookmarked it so I can keep visiting!